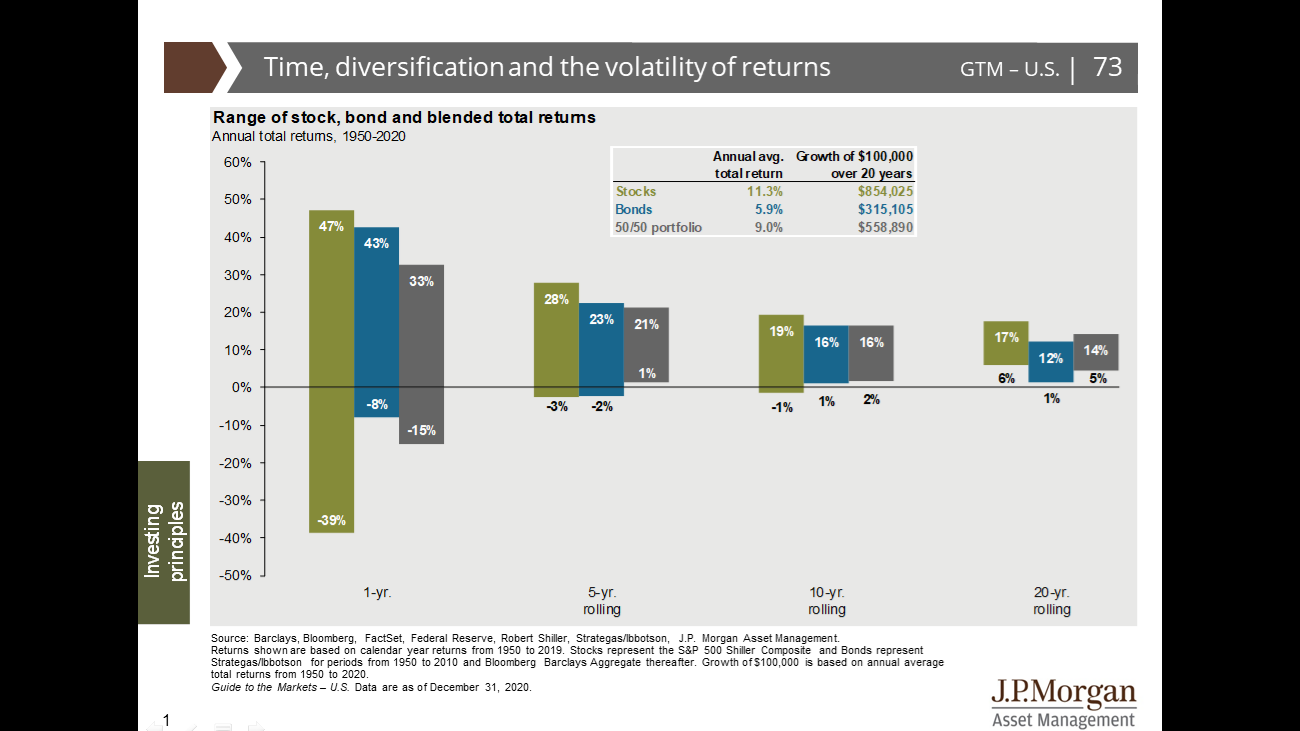
A slightly different format this week. I’ve been reading investment articles, and I thought I’d highlight the parts that interested me. Here is a striking chart from a great article I got from Blackrock. The important lesson here is that very few of our clients actually have the classic 60/40 portfolio. And this chart kind of explains why. With interest rates down around zero for the next year or two, the yield on bonds isn’t going to be anything to brag about. Our Yield model, which would benefit greatly from 14% yield in Treasury bonds, is heavy in dividend paying stocks.
There is still a place for bonds in the portfolio. They are a useful “insurance policy” when the market gets flustered.
This is a blog I’ve wanted to have for a while now. The chart above shows average returns for various asset classes over a period of time. As you can see, the longer the time frame, the smaller the columns get. This means the range of returns narrows.
Here’s where it matters to us. Part of our job is helping clients make decisions about how to invest their money in order to reach their goals. An early conversation about investing will often include a discussion about “the market” and the potential direction of a particular part of that market. This conversation is heavily influenced by the left side of the chart. That’s where the financial press finds stories. If there is volatility in the returns, that means there may be a way to turn that into a story, “Stock A has unexpectedly gone down, or up. Stock B has done the opposite!” That’s where the drama comes from.
Charles and Lisa had been clients for years. We had an exemplary advisor/client relationship: open, clear, and regular communication, and mutual trust. We had long maintained a plan that everyone had confidence in when we suggested taking part in a new exercise.
As trusted stewards of others’ money, we prioritize regularly participating in professional development opportunities. We had recently completed a refresher on the Financial Life Planning program. Our relationship with Charles and Lisa pre-dated this approach, so although we felt we knew them thoroughly, we knew that going back to basics could only strengthen their financial plan. They agreed.
Over the past six months, markets have marched higher almost uninterrupted since the lows back in March, just as the economy was thrown into the deepest recession since the Great Depression. Many investors find this disconnect between the equity market and the economy perplexing and are constantly asking us: is it justified?
The media often interchange the economy and the stock market: when the economy is booming we would expect stocks to behave similarly. This seems logical given U.S companies are based, operate and sell in the U.S. and economic growth impacts company revenue and profits. Likewise, when the economy is in a recession or recovering (as it is now) we would expect stock market movements to mirror (or at the very least be highly correlated) to that changing economic conditions. However, simply taking these assumptions at face value reflects substitution bias.
Substitution bias is the very natural and normal tendency to take mental shortcuts in trying to arrive at a complicated answer, which sometimes leaves us without a complete understanding of the problem itself. Luckily, by leveraging data, checking across sources and, most importantly, being open to a more complex discussion can help in getting around this bias.
While it is always hard to fully attribute where market gains and losses emanate from, we can point out that the economy and the stock market are not in fact 1 to 1 in the U.S. As shown, the composition of the equity market is heavily weighted to technology at 39%, which has done extremely well during this time, yet only 2% of total payroll jobs (Chart 1). Going deeper into the service sector, the industries most impacted by COVID-19 (including retail, hotels and tourism, transportation, entertainment, and restaurants) represent 20% of all payroll jobs and 19% of GDP, yet these same industries only represent about 7% of S&P 500 earnings.
In summary, while the stock market and the economy are linked, they have drastically different compositions, which can lead to the economy and markets appearing to be on different wavelengths. By yielding to substitution bias, investors may think the market rally is not justified, but a deep look under the surface suggests that in fact, it is.
The Story Ginger has always been good at being thrifty. It’s who she is. Though she had significant sources of income and had saved well, it was challenging for her to feel confident that her savings were sufficient to live on for the rest of her life. This is true for a lot of people: it is difficult to interpret the implications on day-to-day life by looking at one lump sum of one’s worth. Ginger came to us wanting to know that what she had meticulously saved throughout her life would simply be enough.
The Story Bill and Mary have both led full, successful careers. Their combined salaries support a high standard of living. They consistently contribute to retirement accounts and have assumed that this is enough to carry their standard of living through retirement. When the couple began discussing retirement, they assessed their accounts. The money seemed like a healthy amount. But for a second opinion, they sought our professional advice. When we translated the sum of savings to a monthly budget, Bill and Mary were stunned. The monthly amount was not nearly what they’d thought it’d be.
The Story We met Steve when he was in his late 50’s. He had worked as an engineer for all of his life, and he was starting to think about the next chapter. With an excellent pension and an IRA, he knew he was set for a secure retirement – five to seven years in the future. But Steve was ready to make that future his reality much sooner. We became his partner in figuring out how to help Steve retire on his terms.
The Story Alicia and her husband, Leon, both found careers in real estate. She’s a broker; he worked with mortgages. But if you met them at a party and were to ask them about themselves, this is not the first thing they would tell you. Instead, they’d likely tell you about their bike tour of The Netherlands last month, and their planned trip to the French Riviera they are currently planning. For them, work has always been a means to an end – not the end itself. This is where our conversations with the couple started.
The Story Paul is an attorney. That is who he has always been – it is how he, and those around him, have defined his identity. Throughout his career, he’s put in the long nights and extra miles. Eagerly. He loves what he does; he loves the craft of it. Now approaching the next decade of his life, things are changing. He and his wife, Lucille, began asking: What does retirement for us look like?
Retirement marks significant life change. For generations, the expectation for turning the page to this chapter of life has been this: after working nine-to-five until your mid-60’s, you stop and spend the next 8 to 10 years winding down. This trajectory accounts for a lifespan of about 72 years and one career-long, full-time job. A few decades ago, that trajectory made sense, mathematically. Life expectancy was about 72, and people tended to hold the same job and contribute to the same pension for their whole career. But now, we are living longer. We are working differently. The way we retire must change, too.